Commercial Vehicle MRO by Region: Who Grows Fastest to 2035
The commercial vehicle MRO market covers the maintenance, repair and overhaul work that keeps trucks, buses and vans earning revenue. Its growth is not spread evenly: the report shows a gap of 2.6 percentage points between the fastest and slowest regions. This regional view walks through each one from quickest to slowest, with the likely reason behind its pace.
Where does commercial vehicle MRO grow fastest through 2035?
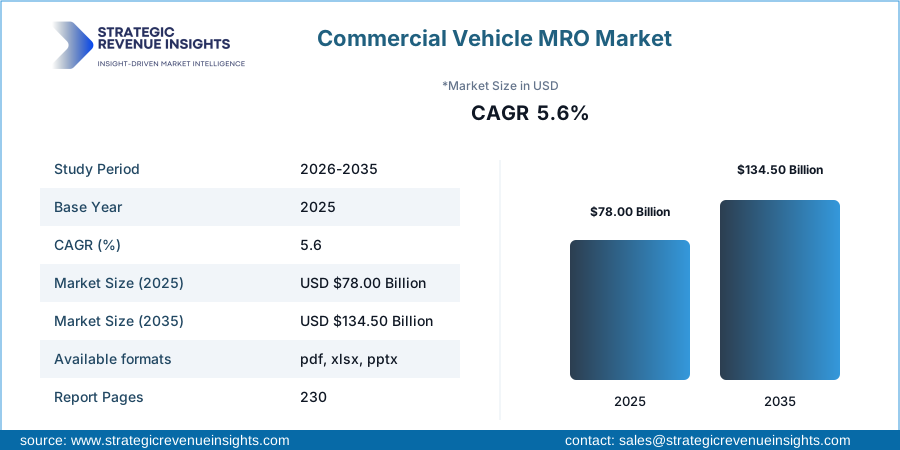
Across all regions, spending rises from $78.00 Billion in 2025 to $134.50 Billion in 2035, a growth multiple of 1.7x. The 2030 estimate is $102.43 Billion. Heavy commercial vehicles are the largest segment at 44.00% of 2025 spending, and preventive maintenance is the largest service type at 38.00%.
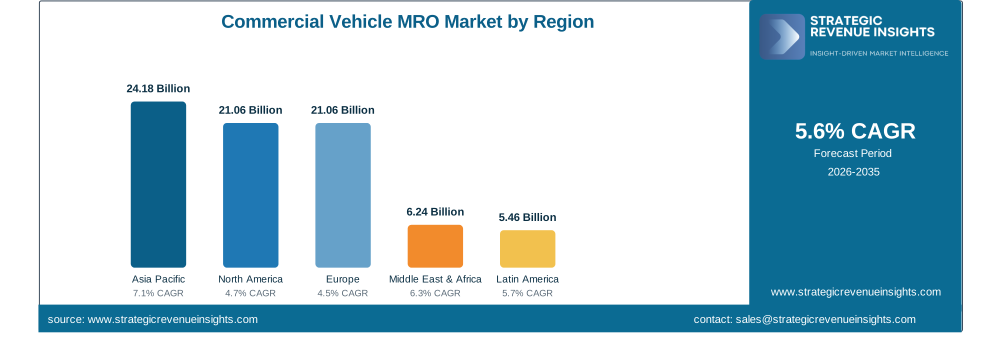
Asia Pacific: 7.1% a year, $24.18 Billion
Asia Pacific is both the largest and the fastest region. Its fleet is expanding, and a larger fleet means more kilometers, more wear and more service visits. The report names fleet growth as the reason the region outpaces every other. The limit is quality of data: fleets in the region vary widely in age and in how formally they schedule service, so the average growth rate hides a wide spread between countries.
Middle East & Africa: 6.3% a year, $6.24 Billion
This is the second fastest region from a small base. Growth from a base of $6.24 Billion is easier to achieve than growth from a base of $24.18 Billion, so the percentage should be read with that in mind. Freight and e-commerce activity add kilometers to each truck, which shortens service intervals, and that effect tends to be strongest where road transport carries most goods.
Latin America: 5.7% a year, $5.46 Billion
Latin America grows slightly faster than the 5.6% global rate. Ageing vehicles are the plausible driver, because older trucks need more repair, parts and overhaul work per vehicle. The report links an ageing truck parc to 1.6 percentage points of growth overall. Currency swings and uneven fleet financing are the main risks for operators here.
North America: 4.7% a year, $21.06 Billion
North America sits below the global rate but remains one of the two big regions by value. Telematics-based predictive maintenance is a strong theme, and the report credits it with 1.4 percentage points of growth globally by turning breakdown repair into planned work. That shift can reduce unplanned spending per vehicle, which is one reason mature markets grow more slowly.
Europe: 4.5% a year, $21.06 Billion
Europe matches North America in value and trails it in growth. Inspection and emission rules contribute 1.0 percentage point of growth in the report, because mandatory roadworthiness and diagnostic checks create steady demand. Official statistics point to a relatively young fleet doing the work: Eurostat's page on road freight transport by vehicle characteristics states that goods vehicles aged 5 years or less performed 60% of road freight transport in tonne-kilometres in the EU in 2024. Newer vehicles need fewer major repairs, which is consistent with the slower pace.
| Rank | Region | CAGR | 2025 value |
|---|---|---|---|
| 1 | Asia Pacific | 7.1% | $24.18 Billion |
| 2 | Middle East & Africa | 6.3% | $6.24 Billion |
| 3 | Latin America | 5.7% | $5.46 Billion |
| 4 | North America | 4.7% | $21.06 Billion |
| 5 | Europe | 4.5% | $21.06 Billion |
How do the regions compare?
Reading the table above as a whole, size and speed point in different directions. The two mature regions, North America and Europe, are the slowest, while the smaller regions are quicker because they start from lower service volumes and add vehicles faster. Asia Pacific is the exception to the small-base rule, since it is the largest region and still the fastest, which is why it deserves the closest attention from suppliers planning capacity. That pattern is common in maintenance markets, but it does not guarantee that the ranking will hold for the full ten years, since fleet renewal can slow growth in any region.
Three of the five regions grow faster than the 5.6% global rate, while North America and Europe, which together hold $42.12 Billion of the $78.00 Billion, grow more slowly. The global rate therefore depends on Asia Pacific. Fleet growth drives the fast regions, and fleet age and inspection rules drive the slow ones. Operators in mature markets should plan on efficiency gains from predictive maintenance, and those in emerging markets on capacity.
What this means for operators and investors
- Fleet owners in slower regions can gain most from telematics, since planned work costs less than breakdown repair.
- Service providers weighing expansion should note that Asia Pacific offers scale and Middle East & Africa offers speed from a smaller base.
- OEM authorized service gains share because makers see connected fault data first, which pressures independent workshops to invest in diagnostics.
Buyers of service contracts should also check how much of a provider's revenue depends on a single vehicle type, because heavy vehicles carry 44.00% of spending and a downturn in long-haul freight would hit them first. As a limit, the forecast assumes freight activity stays healthy and that fleets keep adding vehicles. A freight recession or slow fleet renewal would change both the growth rates and the regional ranking.
Frequently asked questions
How big is the commercial vehicle MRO market?
The commercial vehicle MRO market is worth $78.00 Billion in 2025 and is forecast to reach $134.50 Billion by 2035. The report expects $102.43 Billion in 2030, along the way.
Which region grows fastest?
Asia Pacific grows fastest at 7.1% a year, helped by fleet growth. Middle East & Africa follows at 6.3%, and Latin America grows at 5.7% a year.
What is the largest segment?
Heavy commercial vehicles lead with 44.00% of 2025 spending. By service type, preventive maintenance is the largest at 38.00%, ahead of repair, overhaul, and inspection and diagnostics.
Who are the leading companies?
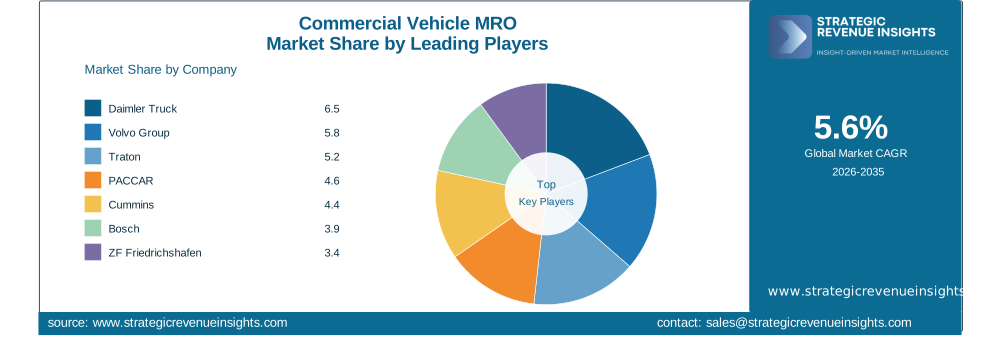
Daimler Truck holds 6.5%, Volvo Group 5.8%, Traton 5.2%, PACCAR 4.6%, Cummins 4.4%, Bosch 3.9% and ZF Friedrichshafen 3.4%.
Sources cited
Market figures come from the Commercial Vehicle MRO Market Size, Share and Growth Forecast 2026-2035 by Strategic Revenue Insights, with a 2025 base year and a forecast to 2035. The report explains its research method, segment definitions and company coverage in full. Context figures are taken from the official government and intergovernmental sources listed above, as published on their own websites.
More market notes on this blog
- 7 Numbers That Explain Where Cosmetic Packaging Is Heading by 2035
- Rolling Stock MRO Market: Why Train Maintenance Grows to USD 81.53 Billion by 2035
- Internet Service Providers Market: USD 950 Billion Today, USD 1.46 Trillion by 2035
- 5G Security Market Data Walk-Through: From $3.60 Billion to $77.93 Billion
Full methodology, segment tables and company profiles are in the Commercial Vehicle MRO market report by Strategic Revenue Insights.
Cite this data
Strategic Revenue Insights (2026). Commercial Vehicle MRO Market Size, Share and Growth Forecast 2026-2035. https://www.strategicrevenueinsights.com/industry/commercial-vehicle-mro-market
License: CC BY 4.0. You are free to reuse these figures and charts, provided you credit Strategic Revenue Insights and link to the source report.
Embed this chart
Copy this HTML to show the chart on your own site:
<a href="https://www.strategicrevenueinsights.com/industry/commercial-vehicle-mro-market"><img src="https://www.strategicrevenueinsights.com/reports/market-overview/commercial-vehicle-mro-market.webp" alt="Commercial Vehicle MRO market chart" width="800"></a><br>Source: <a href="https://www.strategicrevenueinsights.com/industry/commercial-vehicle-mro-market">Strategic Revenue Insights</a>
Comments
Post a Comment