Laboratory Chemicals Market: Five Assumptions Tested Against the Data
The laboratory chemicals market sits behind almost every test, assay and release batch, which makes it easy to describe in broad strokes and easy to get wrong in the details. This note takes five common assumptions about the market and checks each one against the report figures.
How big is the laboratory chemicals market in 2035?
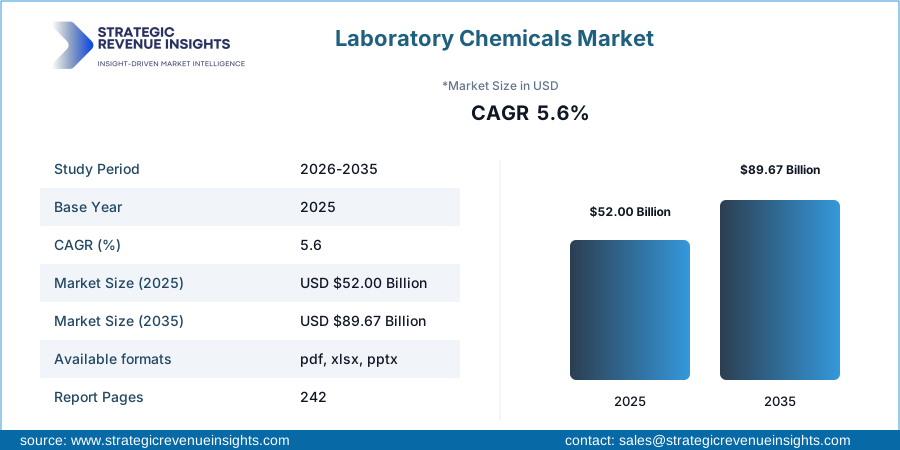
The report puts the market at USD 52.00 Billion in 2025 and USD 89.67 Billion in 2035. That is a gain of about USD 37.67 Billion over the decade, or a 1.7x rise. The path in between is steady rather than abrupt: the 2030 value is projected at USD 68.28 Billion.
One assumption sits behind these figures. Testing and research budgets keep growing in step with each other, so consumption of certified, high-purity inputs rises with them. If budgets stall, the forecast bends first.
Which assumptions about the market hold up?
Assumption 1: a mature chemicals category cannot grow quickly
Laboratory chemicals are old products, so slow growth looks like the natural expectation. The figures say otherwise. A 5.6% CAGR over 2026 to 2035 is a healthy pace for a base of USD 52.00 Billion, because each year adds a larger absolute amount than the last. Public research money gives a sense of the backdrop: Eurostat's Statistics Explained page on R&D expenditure states that in 2024 the EU spent €403 billion on research and development, with R&D expenditure at 2.24% of GDP. That is context for demand, not a figure from the market report, and it does not translate directly into chemical sales.
Assumption 2: solvents drive the whole market
Solvents are indeed the largest type, at 30.00% of 2025 value, worth USD 15.60 Billion. But the fastest growth is elsewhere. Analytical standards grow at 6.8% a year, and HPLC grade chemicals at 6.7% as chromatography use spreads. A buyer who looks only at the largest line misses where the faster growth in the basket is happening.
Assumption 3: growth is spread evenly across regions
It is not. The regional growth rates run from 4.7% in North America to 6.9% in Asia Pacific, with Europe at 4.8%, Latin America at 5.3% and Middle East & Africa at 5.8%. Asia Pacific is also the largest region by value at USD 16.12 Billion, a 31.00% share, just ahead of North America at USD 15.60 Billion. Over a decade, a gap of more than two percentage points a year in growth rate is enough to change the ranking of regions.
Assumption 4: pharma and biotech alone set the pace
Pharma and biotech is the largest end user, with 38.00% of value, so the assumption has a real basis. Yet it leaves out diagnostics, where demand for reagents and buffers grows at 6.5% a year, faster than the market as a whole. Food testing laboratories, academic institutes and the chemical industry fill out the end-user list. The sensible reading is that pharma sets the scale, and several smaller users add growth at the edges.
Assumption 5: scale players leave no room for anyone else
The leaders are visible: Thermo Fisher Scientific holds 11.0%, Merck KGaA 9.5% and Avantor 8.5%, so the three together account for 29.0% of the market. Honeywell (4.5%), Fujifilm Wako (4.0%), Tokyo Chemical Industry (3.5%) and Mitsubishi Chemical (3.0%) follow. The remainder is spread across many suppliers, which is consistent with a market where grade, purity and local service matter as much as brand.
Where does demand actually come from?
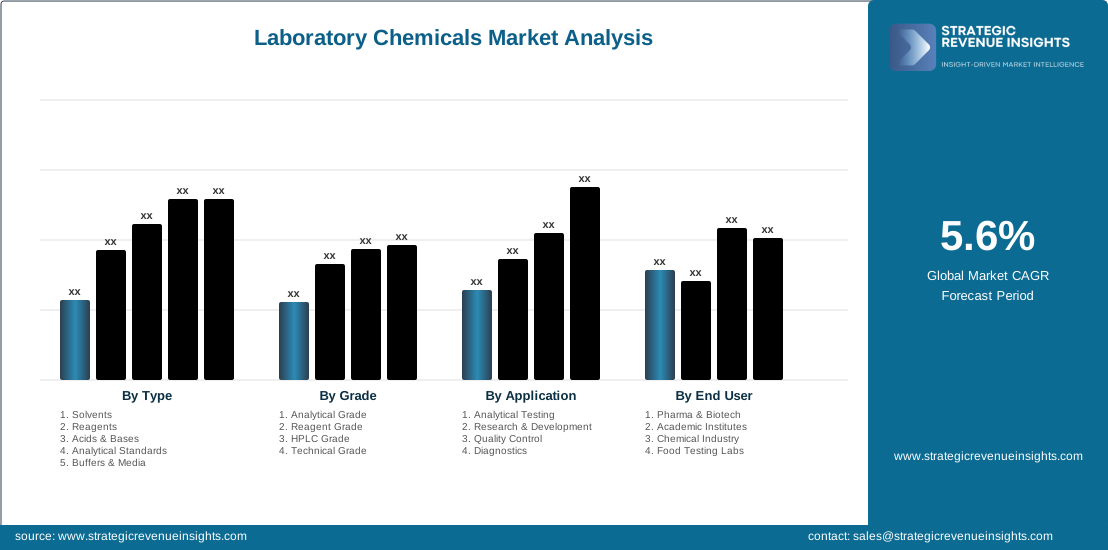
The report splits the market by type, grade, application, end user and region. The chips below show the categories used throughout this note.
Two buyer behaviours are worth noting. Ready-to-use buffers and recycled solvents are gaining with buyers, and the move toward HPLC grade supports better pricing and longer supplier relationships. Both point toward quality and convenience rather than the lowest price per litre.
What this means for buyers, suppliers and investors
- Buyers: negotiate on the fast-growing lines, such as analytical standards and HPLC grade, where supply may tighten before it does for commodity solvents.
- Suppliers: Asia Pacific offers the fastest growth, but North America and Europe still hold a large combined base worth USD 28.60 Billion.
- Investors: favour portfolios that mix the large, steady solvent base with the faster-growing standards and diagnostics lines.
| Assumption | What the figures show | Verdict |
|---|---|---|
| Mature means slow | 5.6% CAGR to 2035 | Not supported |
| Solvents lead growth | Largest by value, not fastest (analytical standards 6.8%) | Partly true |
| Even regional growth | 4.7% to 6.9% a year | Not supported |
| Pharma sets the pace | 38.00% of value, diagnostics at 6.5% | Partly true |
| Leaders dominate | Top three hold 29.0% | Partly true |
One limit applies to every number above: the forecast rests on research and testing budgets continuing to rise, and a sharp cut in public or pharma funding would lower the path. Treat the figures as a central case, not a guarantee.
Frequently asked questions
How big is the laboratory chemicals market?
The market is worth USD 52.00 Billion in 2025 and is forecast to reach USD 89.67 Billion by 2035, according to the report.
What is the growth rate of the laboratory chemicals market?
It grows at a 5.6% CAGR from 2026 to 2035, which adds up to a 1.7x rise over the decade.
Which region grows fastest?
Asia Pacific, at 6.9% a year. It is also the largest region, with a 31.00% share and USD 16.12 Billion of 2025 value.
Which type is the largest segment?
Solvents, with 30.00% of 2025 value, worth USD 15.60 Billion. Analytical standards grow faster, at 6.8% a year.
Sources and further reading
- Eurostat, R&D expenditure - Statistics Explained (2024)
Market figures come from the Laboratory Chemicals Market Size, Share and Growth Forecast 2026-2035 by Strategic Revenue Insights, with a 2025 base year and a forecast to 2035. The report explains its research method, segment definitions and company coverage in full. Context figures are taken from the official government and intergovernmental sources listed above, as published on their own websites.
Also on this blog
- 7xxx Series Aluminum Alloy Market: 9 Checks Before You Buy or Enter
- Robotics Market Case: Where a Mid-Size Supplier Should Expand to 2035
- Commercial Vehicle MRO by Region: Who Grows Fastest to 2035
- 7 Numbers That Explain Where Cosmetic Packaging Is Heading by 2035
Figures from the Laboratory Chemicals Market Size, Share and Growth Forecast 2026-2035, published by Strategic Revenue Insights.
Cite this data
Strategic Revenue Insights (2026). Laboratory Chemicals Market Size, Share and Growth Forecast 2026-2035. https://www.strategicrevenueinsights.com/industry/laboratory-chemicals-market
License: CC BY 4.0. You are free to reuse these figures and charts, provided you credit Strategic Revenue Insights and link to the source report.
Embed this chart
Copy this HTML to show the chart on your own site:
<a href="https://www.strategicrevenueinsights.com/industry/laboratory-chemicals-market"><img src="https://www.strategicrevenueinsights.com/reports/market-overview/laboratory-chemicals-market.webp" alt="Laboratory Chemicals market chart" width="800"></a><br>Source: <a href="https://www.strategicrevenueinsights.com/industry/laboratory-chemicals-market">Strategic Revenue Insights</a>
Comments
Post a Comment